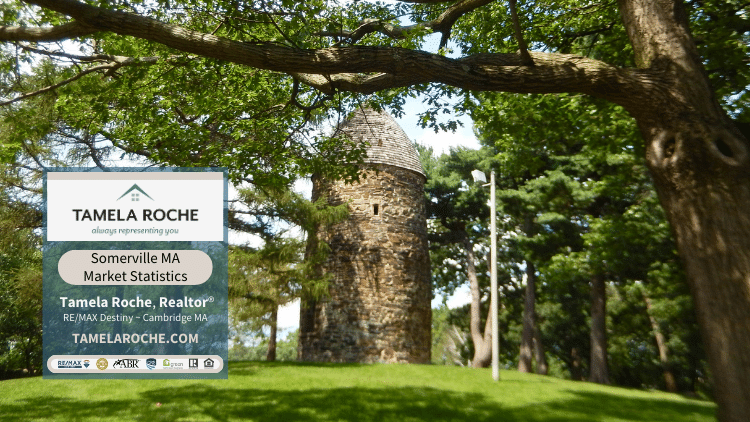
Real estate market statistics showing the Somerville MA home price for Condo, Single, and Multi-Family homes sold 2021 through 2023 are provided below.
Somerville MA Home Price
| Property Type | Avg. Sale $ | Median Sale $ | SP:OP |
| Condo | |||
| YE 2021 | $850,127 | $785,000 | 101% |
| YE 2022 | $872,366 | $810,000 | 101% |
| YE 2023 | $939,257 | $873,750 | 99% |
| Single Family | |||
| YE 2021 | $1,080,142 | $965,000 | 102% |
| YE 2022 | $1,218,409 | $1,100,000 | 103% |
| YE 2023 | $1,230,793 | $979,900 | 99% |
| Multi-Family | |||
| YE 2021 | $1,366,628 | $1,200,000 | 97% |
| YE 2022 | $1,431,988 | $1,250,000 | 100% |
| YE 2023 | $1,318,349 | $1,275,000 | 100% |
KEY: YE = Year End SP:OP = Sales Price to Original Price Ratio
Data Source: MLS Pinergy® as of 2-26-2024
©2024 Intellectual property of Tamela Roche, all rights reserved
Somerville MA Home Inventory
A comparison of the total number of homes listed for sale in Medford MA from 2021 to 2023 are provided below:
| Property Type | YE 2021 | YE 2022 | YE 2023 |
| Condo | 737 | 663 | 554 |
| Single-Family | 120 | 122 | 100 |
| Multi-Family | 305 | 239 | 224 |
KEY: YE = Year End
Data Source: MLS Pinergy® as of 2-26-2024
©2024 Intellectual property of Tamela Roche, all rights reserved
Average Home Price Somerville MA
How Is Average and Median Price Calculated?
In order to calculate an average home sale price, divide the total number of homes sold by the total sum of all home sale prices. Find the median sale price by sorting the data from the lowest to highest price, then find the middle value. It is not unusual in our local markets for the average sale price and median sale price to be significantly different.
Why Is Median Home Price Important?
Despite the fact that most media outlets will focus on the average home sale price in news about real estate; the median sale price is also very important. Mortgage underwriters watch median home sale price activity to determine risk for lending in any given market. An underwriter will typically analyze median home sale price activity either by a postal zip code or by the county as a whole.
Changes in the median home price will indicate if the home values are increasing or decreasing. Many factors determine the costs associated with a home mortgage loan. For example, borrowers who purchase a home in a market with decreasing median home sale prices may receive a higher mortgage interest rate.
About Somerville MA
Location
Somerville, Massachusetts is located 2 miles northwest of Boston and comprises approximately 4.1 square miles of land. The postal zip codes in Somerville are 02143, 02144, and 02145.
Style of Government
First settled in 1630, Somerville was later incorporated as a city in 1872 and follows the “Mayor-City Council” style of governing.
Residential Taxes in Somerville MA
The residential tax rate in Somerville MA for fiscal year 2024 is 10.52%. Tax rates are stated as a percentage for every $1,000 of the assessed value. Several types of tax savings are available; including a residential exemption for homeowners who qualify.
For more information: Residential Taxes in MA

To learn more about the average home price and other real estate market statistics in Somerville MA, contact me to schedule a Home Seller or Home Buyer Consultation. Primary service areas also include Arlington, Belmont, Cambridge, and Medford Massachusetts.
About Tamela Roche, Realtor® – RE/MAX Destiny


