

Statistics for Cambridge MA Market as of July 2026 compared to year end 2025 for condo, single family, and multi-family home sales.
Cambridge Market July 2026
Home Sale Price Trends – Cambridge MA
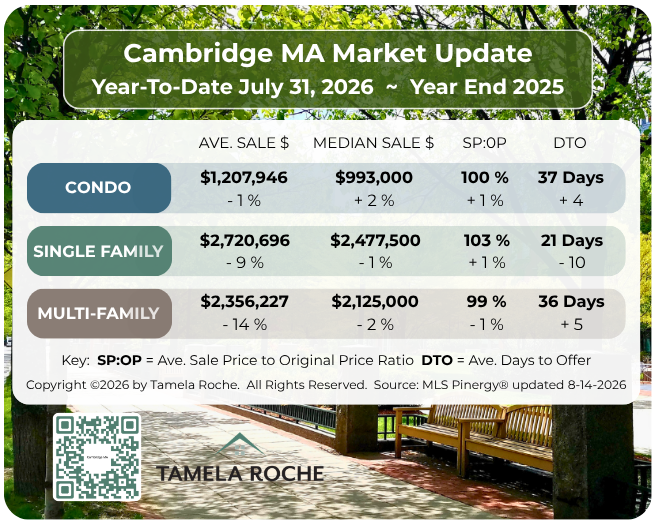
The chart below reflects the home sale price trends for year-to-date July 31, 2026 compared to year end 2025 in Cambridge MA. Four key trends shown in the chart includes the average sale price, median sale price, sale price to original price ratio, and average days to offer. The types of residential properties are condo, single family, and multi-family homes. Market statistics below include residential home sales in zip code 02478.
Cambridge Market July 2026
Home Sale Prices Year-To-Date July 31, 2026 ~ Year End 2025
How do home sale prices in the Cambridge Market in July 2026 compare to 2025 and prior years? Here are the results for Condo, Single Family, and Multi-Family homes:
- Condo: Average Sale Price down 1% ($1,207,946) which is the second highest Condo average sale price and Median Sale Price up 2% ($993,000) being the highest median sale price on record for Cambridge MA Condo
- Single Family: Average Sale Price down 9% ($2,720,696) and Median Sale Price down 1% ($2,477,500) being the second highest home sale prices on record for Cambridge MA Single Family
- Multi-Family: Average Sale Price down 14% ($2,356,227) and Median Sale Price down 2% ($2,125,000) which are the second highest home sale prices on record for Cambridge MA Multi-Family
Data Source: MLS Pinergy® updated 8-14-2026
Copyright ©2026 by Tamela Roche. All Rights Reserved.
Cambridge Market July 2026: Perspective
As of July 31, 2026 the Cambridge MA home sale prices are decreasing 1% to 14% year-to-date for Condominium, Single Family, and Multi-Family homes; however, these remain in the top or second highest on record in Cambridge MA. Once exception is the Median Sale Price for Condominiums which is increasing 2% year-to-date.
Bear in mind these market statistics are purely a starting point to show recent home sales activity; further analysis is needed to estimate the fair market value of a specific home.
To see the past 5 years of home sale price trends in Cambridge MA visit: Cambridge MA Market Statistics
Additional Real Estate Market Statistics
Cambridge MA Market Updates
Visit my blog for Cambridge market updates:
Market Statistics 2021 – 2026
For home sale price trends from 2021 to 2026 in Cambridge, Arlington, Belmont, Medford, and Somerville MA visit:
Fair Market Value
What Is The Value Of Your Home?
When you are ready to sell your current home or buy a new home in Cambridge MA, I will conduct further analysis to estimate the fair market value. Every market is unique; not all markets experience the same impact to home sale prices at the same degree or rate of speed.
My Clients receive in-depth market statistics which correlate directly to a specific property type, size, location, and factor in the most valuable features and characteristics. I have been analyzing market statistics for Arlington, Belmont, Cambridge, Medford, and Somerville MA since 1999 to identify trends for my home buyer and home seller Clients. I provide a short and long term perspective to help Clients make educated decisions with confidence and peace of mind.
Real Estate Market Terms
The following terms are referenced in the Cambridge Market July 2026 update:
Sale Price To Original Price Ratio “SP:OP”
The acronym “SP:OP” stands for “Sale Price to Original Price Ratio” and reflects the final sale price as a percentage of the original list price. When this percentage is above 100% that means the home sold for a higher amount than the original list price.
Days To Offer “DTO”
The term “days to offer” (DTO) refers to the number of days from the original listing date until the date upon which a seller accepts a buyer’s offer to purchase. This represents the most accurate measurement of market speed because it shows the buyer’s true sense of urgency.
Days To Offer vs Days On Market
“Days on market” (DOM) is a term used to measure the number of days from original listing date to the date a property status is changed in MLS to “under agreement”. This status code is highly subjective and used inconsistently; therefore, “days to offer” is the most reliable measurement for market speed.

Tamela Roche Realtor
As a Realtor in Cambridge MA since 2002, I represent only you and your best interests as the home seller or the home buyer. I do not represent both sides in the same transaction in order to avoid the practice of “dual agency”. My policy is to represent Clients without any conflict of interest. My service areas include Arlington, Belmont, Cambridge, Medford, and Somerville MA.